
Breeders’ Cup Saturday Win Bets: What 45 Races Reveal About Probability and Price
Five Breeders' Cup Saturdays show where the model found winners, how price changed the return, and why small samples call for restraint.
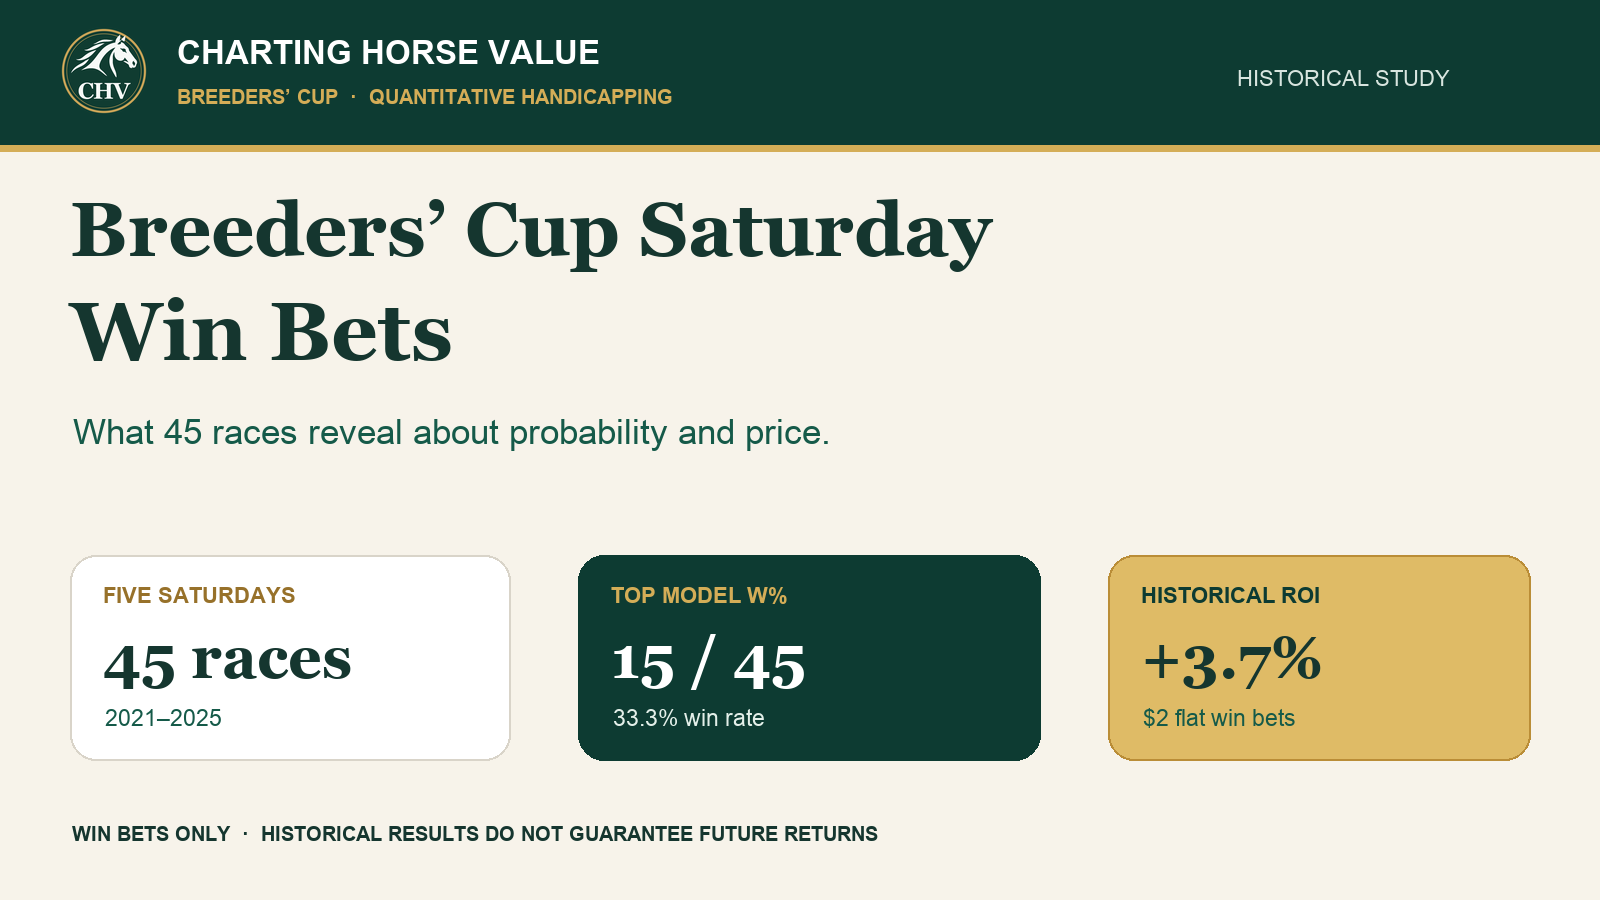
Historical CHV study · 2021–2025 Breeders’ Cup Saturdays · 45 races · Win bets only
Breeders’ Cup Saturday asks handicappers to separate two questions: Which horse is most likely to win, and is the price worth taking? Across these 45 races, the model’s top W% runner won 15 times and returned +3.7% on flat $2 win bets. The shortest adjusted morning-line selection did better in this sample, while the model’s late-speed and pace signals offered a potentially useful, but still small, supporting clue.
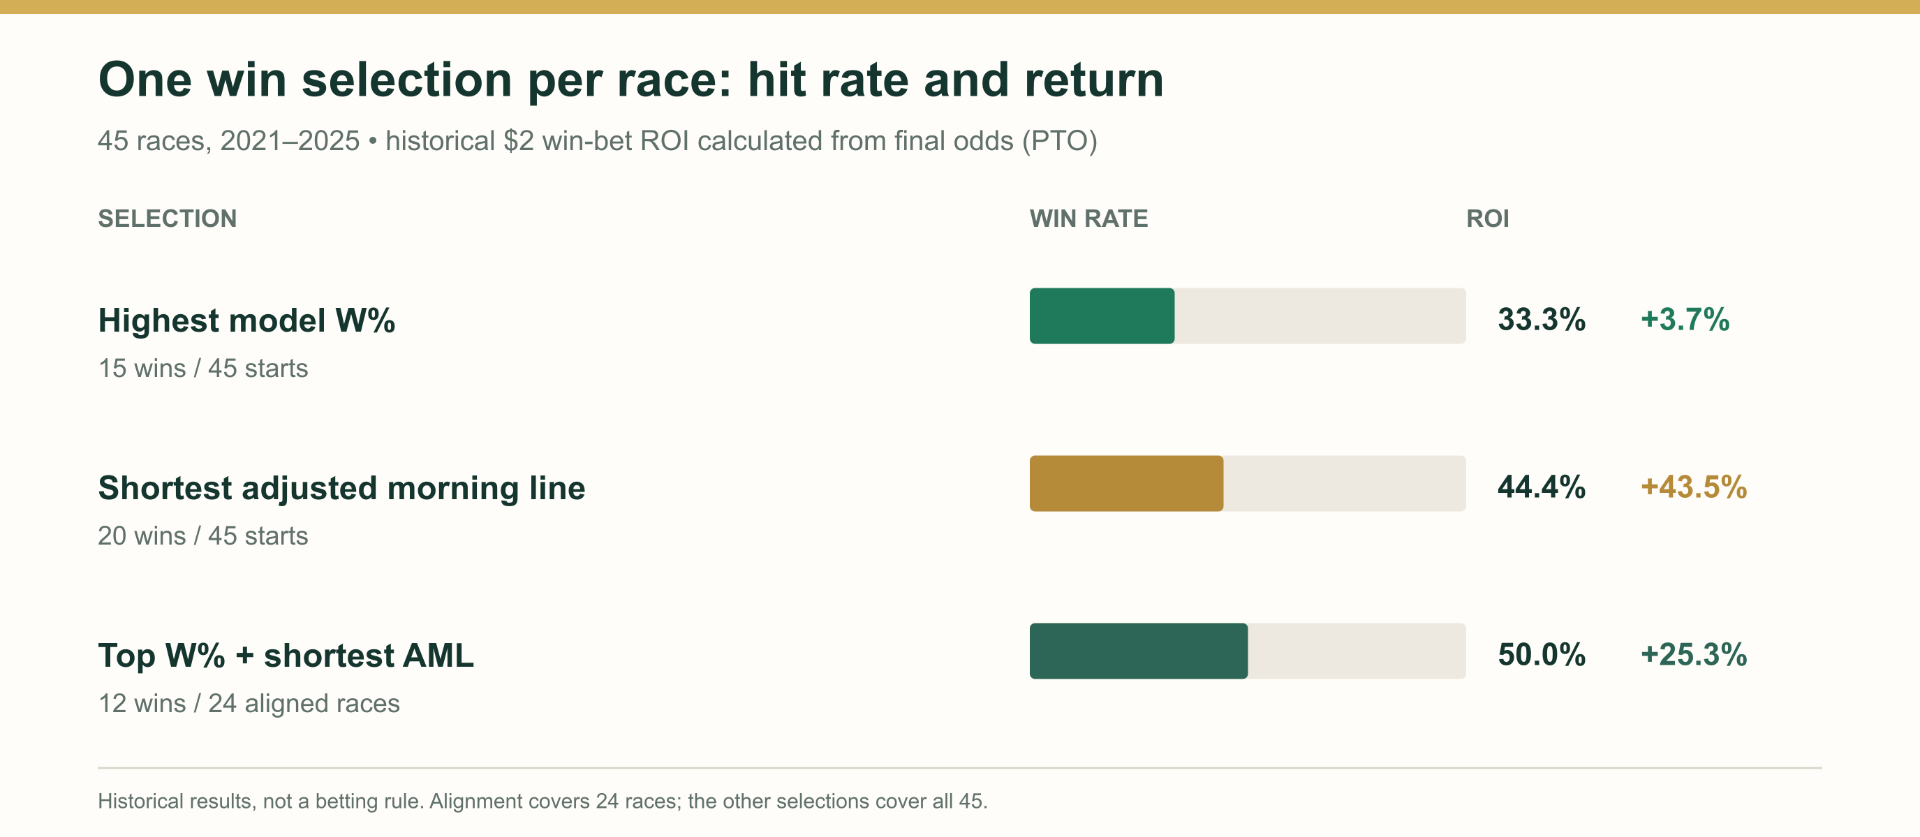
Each row below selects one horse per race. ROI uses the recorded final odds (PTO): a winning $2 bet returns $2 × (PTO + 1); a loss returns zero. The top-W% row returned $93.34 on $90 wagered.
| Selection | Starts | Wins | Win rate | ROI |
|---|---|---|---|---|
| Highest model W% | 45 | 15 | 33.3% | +3.7% |
| Lowest AML (shortest adjusted morning line) | 45 | 20 | 44.4% | +43.5% |
| Top W% and lowest AML were the same horse | 24 | 12 | 50.0% | +25.3% |
AML is CHV’s adjusted morning line, which accounts for scratches; it is not the model’s win-probability estimate. Its strong result is a sample finding, not evidence that short morning-line prices produce a reliable long-run betting edge. The overlap row covers only the 24 races where the two signals agreed; it is a promising shortlist, not a complete-card rule.
Where the top W% pick performed
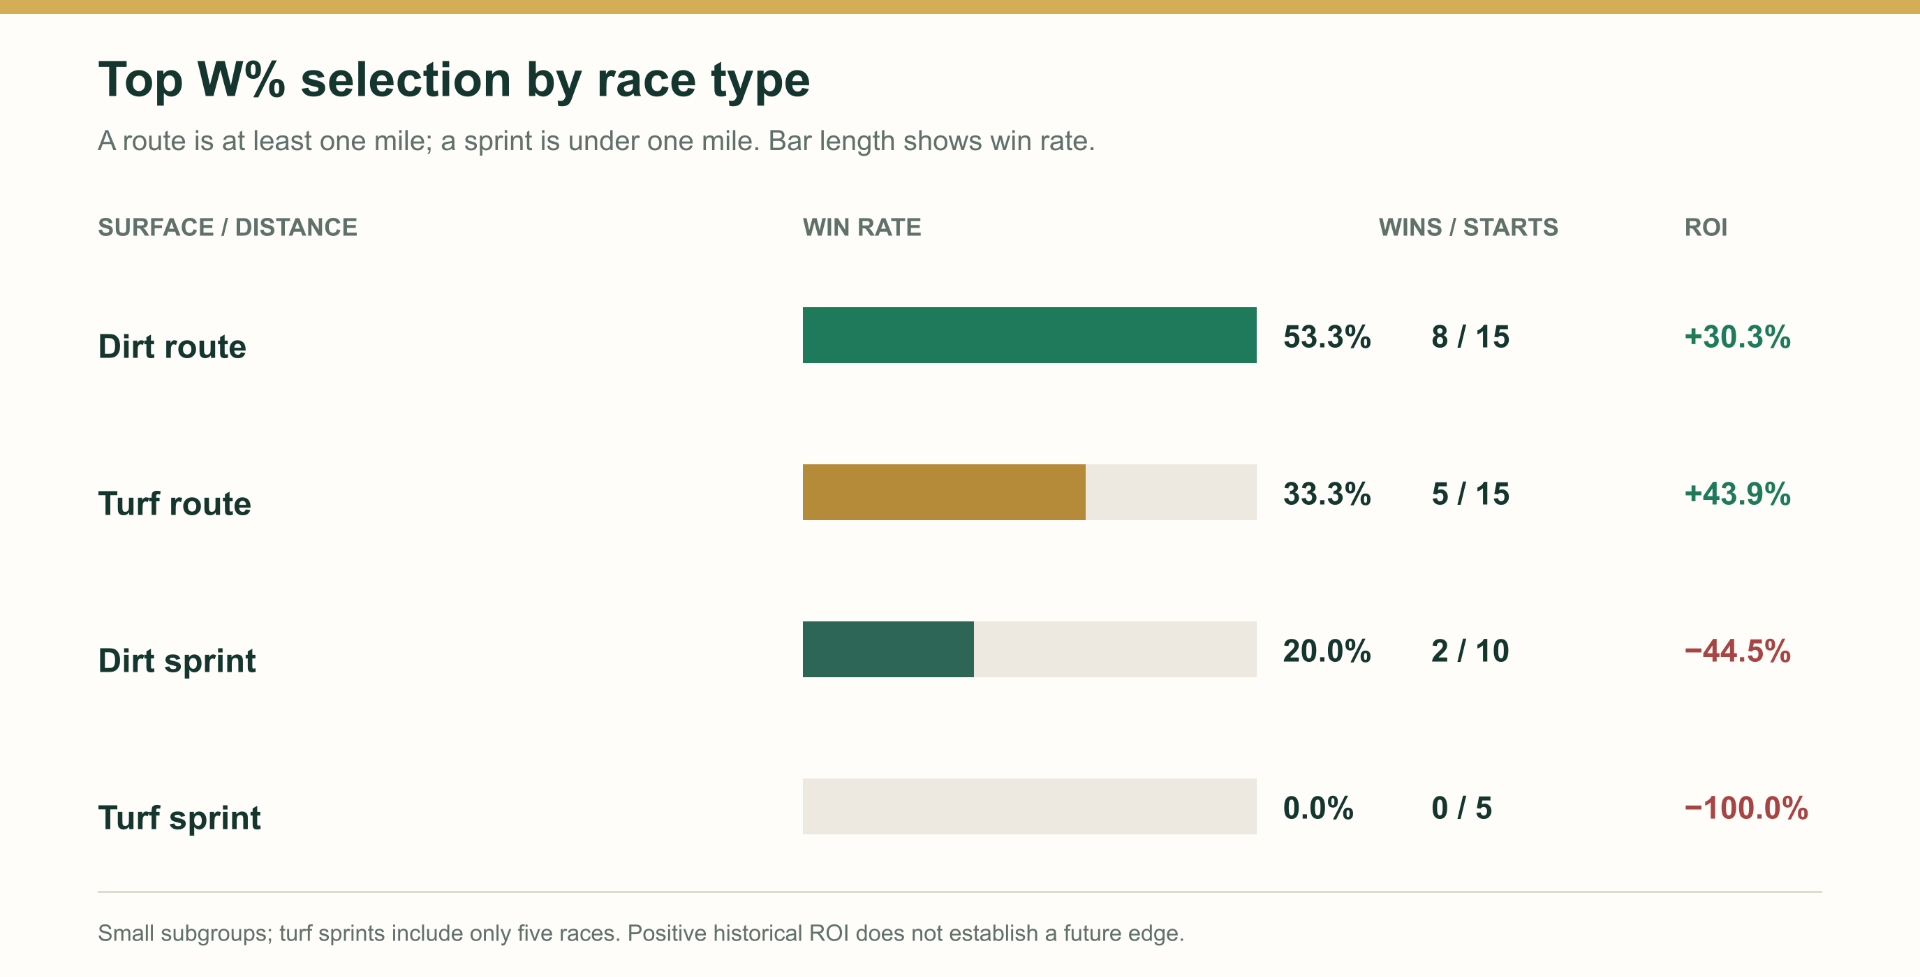
The surface and distance split is worth keeping in view. Here, routes are races at least one mile; sprints are under one mile.
| Surface / distance | Starts | Wins | Win rate | ROI |
|---|---|---|---|---|
| Dirt routes | 15 | 8 | 53.3% | +30.3% |
| Turf routes | 15 | 5 | 33.3% | +43.9% |
| Dirt sprints | 10 | 2 | 20.0% | −44.5% |
| Turf sprints | 5 | 0 | 0.0% | −100.0% |
Routes were the more encouraging setting for the top model selection. Turf routes returned a profit despite a lower hit rate because the winners paid more. The sprint record was weaker, with all five turf sprints missed. Five races are not enough to condemn a race type, but they are a good reason to keep confidence modest.
Angles and value: interesting, uneven evidence
The file contains several FC tags, but some named angle variants do not occur at all. The table reports only tags actually present; overlapping rows are not additive.
| CSV tag / group | Starts | Wins | Seconds | Win rate | ROI |
|---|---|---|---|---|---|
Exact FC=tw |
20 | 2 | 2 | 10.0% | +137.0% |
Any FC containing tw (including combo codes) |
33 | 3 | 3 | 9.1% | +59.7% |
Exact FC=tj |
4 | 1 | 0 | 25.0% | +225.0% |
Exact numeric FC 1, 2, or 3, pooled |
103 | 10 | 9 | 9.7% | −28.4% |
GRD suffix v |
4 | 0 | 0 | 0.0% | −100.0% |
There are no FC=kt records or GRD suffix tr, dr, or + records in this CSV, so there is no result to report for those variants. The positive returns for tw and tj are highly payoff-sensitive: they come from only two and one winners, respectively. They are hypotheses to track prospectively, not betting instructions.
Value also split sharply by band. These are all starters in each VAL range, not one pick per race.
| VAL range | Starts | Wins | Win rate | ROI |
|---|---|---|---|---|
| Below −5 | 148 | 28 | 18.9% | −13.1% |
| −5 to below 0 | 197 | 6 | 3.0% | −37.3% |
| 0 to below 2 | 45 | 3 | 6.7% | −0.5% |
| 2 to below 5 | 50 | 1 | 2.0% | +1.8% |
| 5 to below 10 | 30 | 3 | 10.0% | −58.7% |
| 10 or higher | 18 | 4 | 22.2% | +38.3% |
The highest VAL band is encouraging but has only 18 starters. The middle bands did not form a smooth progression, another warning against searching these results for a magic cutoff. Value should be read alongside the model’s win estimate and the price actually available, not as a standalone green light.
Late speed, pace, and running style
The report classifies PAC scores of 8–10 as hot pace. Within those races, runners ranked in the top three for LS combined for 7 wins from 33 starts, with +80.2% historical ROI. In PAC 2–7 races, the top-three LS group won 14 of 102 and returned −14.5%.
| Pace group and LS rank | Starts | Wins | Seconds | Win rate | ROI |
|---|---|---|---|---|---|
| PAC 8–10, LS ranks 1–3 | 33 | 7 | 2 | 21.2% | +80.2% |
| PAC 8–10, LS rank 1 only | 11 | 3 | 1 | 27.3% | +246.4% |
| PAC 2–7, LS ranks 1–3 | 102 | 14 | 10 | 13.7% | −14.5% |
PAC 8–10, closing style S |
18 | 3 | 2 | 16.7% | +146.1% |
This supports the idea that late speed can matter more when the pace projection is hot, and that an S style may fit some of those setups. But these groups overlap: an S runner may also rank highly in LS. The figures do not isolate an independent LS, pace, or style effect, and a few long-priced winners can move ROI dramatically. Treat pace as race context, not a standalone selection formula.
Two factors that disappointed
Ranking the available horses within each race by TJR and FWR produced poor win-bet results. Each row uses one highest-ranked available horse per race. For FWR ties, modeled W% breaks the tie; counting every tied FWR leader instead gives 48 starters across the same 45 races and still no winners.
| Within-race leader | Starts | Wins | Win rate | ROI |
|---|---|---|---|---|
| Top TJR | 45 | 5 | 11.1% | −55.2% |
| Top FWR (W% tie-break) | 45 | 0 | 0.0% | −100.0% |
That is a clear caution against using either rating as a win-bet selector by itself in this sample. It does not mean the information is useless in every context; it means these rankings did not identify profitable standalone win bets here.
Layoff and the named races
Layoff results were mixed, with the 57–90 day group the most encouraging of the broad bands. The under-21-day return came from one winner and is especially price-sensitive.
| Days since last start | Starts | Wins | Win rate | ROI |
|---|---|---|---|---|
| Under 21 | 16 | 1 | 6.2% | +174.3% |
| 21–56 | 356 | 31 | 8.7% | −40.3% |
| 57–90 | 97 | 12 | 12.4% | +30.9% |
| Over 90 | 19 | 1 | 5.3% | −91.1% |
The 57–90 day range is worth tracking, not turning into a requirement. Its 12 wins are a useful descriptive base, but the group still spans different horses, races, and odds.
The race-name split looks striking—and is only five observations per race. “Top W%” means the highest model W% runner in each edition.
| Breeders’ Cup race | Top-W% wins / starts | Win rate | ROI |
|---|---|---|---|
| Classic | 3 / 5 | 60.0% | +102.8% |
| Dirt Mile | 3 / 5 | 60.0% | +4.0% |
| Filly & Mare Turf | 3 / 5 | 60.0% | +212.0% |
| Mile | 2 / 5 | 40.0% | +19.6% |
| Distaff | 2 / 5 | 40.0% | −16.0% |
| Filly & Mare Sprint | 1 / 5 | 20.0% | −43.0% |
| Sprint | 1 / 5 | 20.0% | −46.0% |
| Turf Sprint | 0 / 5 | 0.0% | −100.0% |
| Turf | 0 / 5 | 0.0% | −100.0% |
The Classic, Dirt Mile, and Filly & Mare Turf are candidates for continued monitoring, not proven “target races.” One additional winner or upset would materially change these small-sample percentages and returns.
The practical read
Start with W% to identify the model’s leading win candidate. Then ask whether the available odds justify a bet. Agreement with the morning line, a favorable value profile, late speed in a hot-pace setup, or a 57–90 day layoff can add context—but none of these findings is strong enough to override price discipline or justify a wager on its own. Passing is part of the process.
This is a retrospective study of 45 races, not a validated forecast. ROI assumes one $2 win bet per starter or selected horse, as appropriate, with returns calculated from recorded final odds (PTO); losing bets return zero. It excludes taxes, rebates, and the effects of odds movement. The tag and subgroup findings involve multiple overlapping comparisons, which increases the risk of chance patterns. More cards and rules set in advance are needed before treating any of these as repeatable edges.
Next article: exactas and other exotic wagers, evaluated separately from this win-bet analysis.
Continue learning with CHV
- Read the CHV Glossary for W%, AML, LS, FWR, TJR, and Form Cycle definitions.
- See how key factors agree in a broader CHV study of win rate and ROI.
- Explore the mobile app and reports to compare modeled probability, fair odds, and value on current cards.
- Browse CHV Insights for more race analysis.